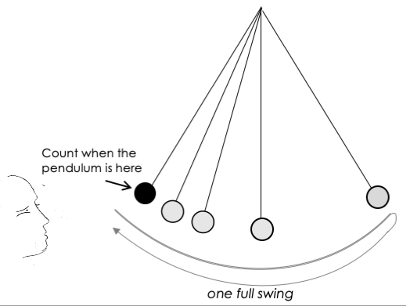
At the Imperial Late on March 12th we hung a giant pendulum bob 5.52 metres from the ceiling. Guests timed the period of the pendulum swing and their measurements were collaged onto two large histograms.
We experimented with two different timing approaches. Some people timed two swings. The periods they measured are plotted on the left histogram in blue and green. Other people timed ten swings. The periods they measured are plotted on the right histogram in red and magenta.
We also asked people to choose where they measured from. Some counted from the top of the swing (magenta and green) and some from the very bottom (red and blue).
Counting from the top.
Counting from the bottom.
What did we learn?
There are some important lessons to be learned by looking at the charts and data.
The spread of results for the 10-swing count (red and magenta) is 5 to 6 times smaller than the 2-swing measurement (blue and green), giving 5-6 times higher certainty about the result. We would expect it to be 5 times more certain, because the timing error is divided by 10 instead of by 2. It is always best to observe over as many oscillations as possible.
The spread of results for measurements made at the highest point (magenta and green) is greater than the spread of those taken at the bottom of the pendulum swing (red and blue). This is because the pendulum’s lowest point is well defined and it passes it at maximum speed, so there is less doubt as to when to begin and stop timing. This is quite different when timing from the highest point where the pendulum lingers as it changes direction, making it hard to identify the decisive moment to begin or halt timing. It is always best to measure at a well-defined point.
How measurements are made is a vital consideration in science. Here, the best strategy to achieve a measurement that minimises uncertainty is to time 10 swings observed at the lowest point of the swing. These are the red data points. Most people were inclined to do the exact opposite and timed 2 swings at the highest point – the green data points.
A summary of our results is shown in the table below.
Note:
1. The +/- error is a statistical uncertainty and indicates that we are 68% confident that the true mean lies within this range.
2. Measurements falling 0.5 seconds above or below the mean were disregarded as errors. The number of readings included from the total are shown in brackets.
Why measure the period of a pendulum?
Aside from being the basis for some interesting reflections on experimental method, there is also the beautiful fact that we can calculate a value for gravity from just the length of the pendulum and its time period.
Our pendulum was 5.52+/- 0.05 m long and the mean period measured was 4.722 +/- 0.001 seconds. This gives us a value for acceleration due to gravity (g) of 9.77+/- 0.09 m/s2. We actually know g in London to be 9.816 m/s2. Our final error was dominated by the error in measuring our pendulum length rather than the error in the period.
If we were to use this exact same pendulum in different places on our globe, nearer the equator (say Mexico City), or nearer the pole (say Oslo) or further from the earth’s centre (say 2000m altitude), it could be used to quite accurately tell us the difference in gravity compared to our measurement in London.
Thanks
Thank you to everyone at the Imperial College Centre for Cold Matter who helped create this project: Julia Bieniewska, Luke Caldwell, Mike Tarbutt, Thom Wall and Sid Wright.


